What is business intelligence? To summarize it simply, it’s about bringing together certain company data and presenting it in a way that helps make decisions. These data comes from databases used by company software as well as other sources, such as the Internet. For a more detailed definition, here is a link to Wikipedia.
Much of the data required comes from your ERP databases. The DCision ERP software includes several business intelligence tools:
- Excel Reports and Exports
- Cross-Analyzes
- Dashboards
DCision ERP users are already familiar with many of the reports, exports and cross-analyzes available. We will focus on cross-analysis in a future article. Let us focus here on the dashboard.
A management dashboard provides an overview of the company and evaluates its performance over time. It must be defined according to the key performance indicators (KPI) of your company. Here are some examples of key indicators: the gap between forecasted and actual sales, the profitability of ongoing projects and the absenteeism rate by department.
Here is an example of a dashboard containing a cash flow, a view on the budget forecasts (actual versus budget), on the absenteeism rate and finally on the projects in progress, at the budget level:
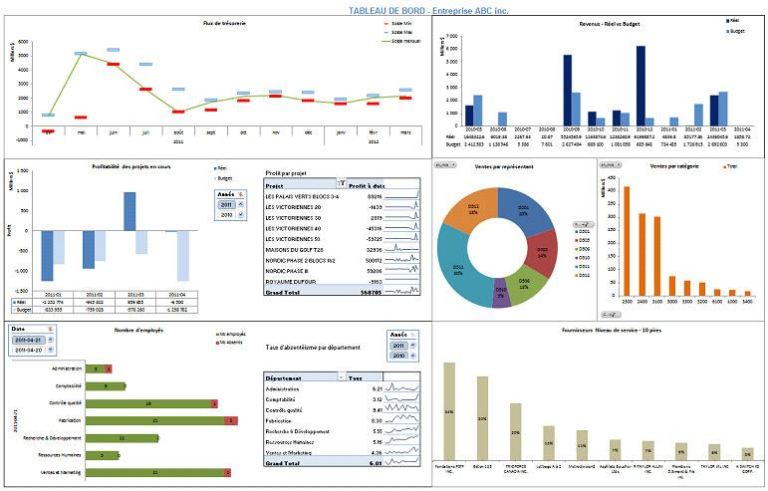
A dashboard presents these indicators in the form of graphs giving an overview in a single window allowing to quickly detect problems and make decisions. The technology used consists of periodically gathering the necessary data in a Data Warehouse. This data comes from your DCision ERP databases and other sources. Finally, Excel spreadsheets are defined and connect to the data warehouse to present the desired key performance indicators. Using Excel eliminates having to purchase an expensive product and have to provide extensive training to users. The Data can be constantly refreshed because the spreadsheet remains constantly connected to the data warehouse.
Contact us to learn more about our solutions and this offer!